[T]he story in which the housing bust gave us the recession, because America suddenly had lots of houses and workers it couldn't use doesn't appear to fit the data. The economy muddled on despite the housing bust for two years, at which point, for some reason, all sectors suddenly decided that the outlook for growth was much worse than they'd previously believed.But what about the story where the housing bust gave us the recession, because households underwater on their mortgages suddenly upped their savings rates, which was enough of a hit to aggregate demand to cause other households to save more out of fear as well? In short: the collapse of housing prices, rather than the collapse in demand from the housing sector, drove the recession.
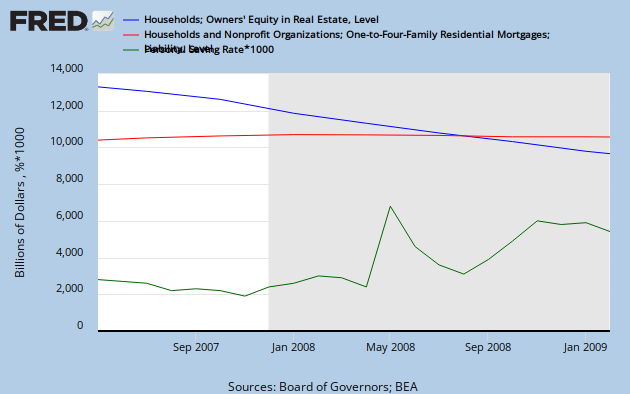
The data certainly seems to conform with this general narrative. Here are owners' housing equity (blue) plotted against home mortgage liabilities (red) and the personal savings rate (green).
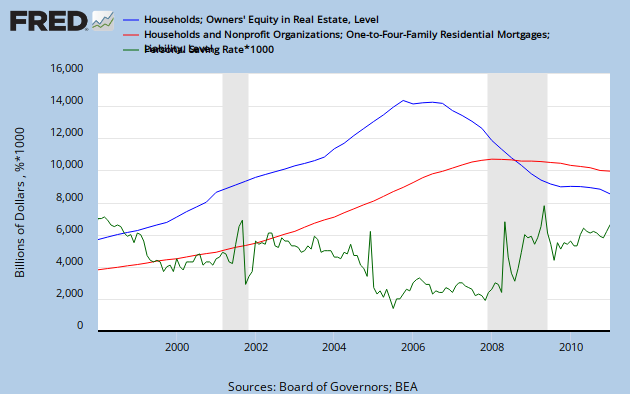
The now familiar tale of the financial calamity of the bubble decade emerges from this picture. The savings rate evaporated at the height of the boom as homeowners alternatively tapped home equity loans or counted on asset appreciation as a form of de facto savings. This reversed a bit when housing prices began to decline in the second half of 2006, but, still, personal savings only nudged up a modest amount. Indeed, it was not until shortly after the value of outstanding mortgage debt surpassed owners' household equity in August 2007 -- a first for the post-war period -- that the savings rate began to spike. This deserves special consideration.
There is a peculiar psychology to zero, at least when it comes to net wealth. Karl Smith recently pondered the irrationality of our fixation with the number, but the reality remains: there is a fundamental aversion to going below it. That mortgage debt eclipsed household equity in late 3Q2007 does not, of course, tell us the exact percentage of households underwater, but it is a decent proxy for the widespread state of disrepair of household balance sheets -- a sad fact that has significant implications. Households (or corporations) whose chief financial asset and piece of collateral has pushed their net worth below zero drastically change their habits. It may be that no rate of interest can induce them to borrow more; they prefer to pay down debts instead in an effort to erase their financial holes. This was infamously the case during Japan's Lost Decade, when corporations deleveraged apace despite the ready availability of literally free money.
Even so, why should increased savings from paying down debts act as a drag on aggregate demand? After all, basic economics tells us that banks and other financial intermediaries should recycle savings back into the economy via loans. Unfortunately, the wholesale mistrust that ruled financial markets, and the subsequent credit crunch, that was endemic from August 2007 onwards prevented this mechanism from functioning correctly.
Banking problems reinforced three interrelated negative feedback loops, with the end result economic armageddon. The first among these related to foreclosures: when one (former) homeowner defaults on a mortgage, this depresses the value of their neighbors' homes. If these neighbors are left with negative equity, they are then unable to refinance their mortgages, and have a reduced incentive to not walk away. Put more clearly, foreclosures are contagious. Increased savings in response to this collapse in housing values was the second feedback loop. As first subprime and then prime borrowers set aside more money to pay their mortgages, this effectively sucked cash out of the economy due to banks not lending the money back out. Businesses reacted to this lessening of demand by slowly cutting back, which caused fear to spread, and savings to rise among workers. Finally, asset values kept falling as these forces worked their way through the economy, further impairing banks' capital. With banks looking to de-risk, they became even more reticent about lending. And so on, and so on.
Thankfully, the government (finally) moved to arrest this downward cycle. But could the Fed have mitigated the slump with aggressive, pre-emptive action? Almost certainly. If the Fed had eased to accommodate the excess demand for money that arose due to the collapse of subprime securities and other seemingly safe cashlike assets in late 2007, the panic in the financial sector would almost certainly not have been quite as acute. This is not to say, however, that there would have been no recession. Instead of a precipitous decline in late 2008, perhaps there would have been a gradual one, as households continued deleveraging in response to falling house prices. Nothing short of a sustained burst of inflation that would simultaneously erode the real value of debts and, more importantly, reflate housing values would change this dynamic. Theoretically, the Fed could engineer such above-trend inflation over the medium-term if it was willing to embrace radical enough policies. A combination of institutional and political concerns make it difficult for the Fed to credibly commit to such a program. This is deeply unsatisfying, but no less true.
The lesson of our Great Recession is not only that central banks need to shed their discomfort in engaging in unconventional policies, but also that asset prices -- particularly those used as collateral -- are central to the economy. Ignore them, and their affect on private sector balance sheets, at our economic peril.
But when your blue line crosses your red line, that means that owner's equity is, on average, 50%. Even if 0% is a magic number (which it is), the blue line crossing the red line is not that magic number.
ReplyDeleteNick gets this right. A = L + E, and just because L > E does not mean that A < 0. I agree there are psychological impacts to zero, but this is likely because there are practical impacts as well.
ReplyDeleteThe problem is that using an aggregate number probably distorts the issue - which is not when overall housing equity drops to 0%, but when a critical mass of homeowners individual equity drops to 0% or below. That would probably be a more revealing chart.
ReplyDelete@NickRowe Nick, you are certainly correct. The title of the post was misleading about the implications of the values of household equity and outstanding mortgage intersecting. The point I was trying to make was that while this didn't tell us anything definitively, it clearly implied a much greater percentage of households with zero or negative equity.
ReplyDelete